

Technical Analysis
2021.10.07 07:21
Hi It's Unicorn
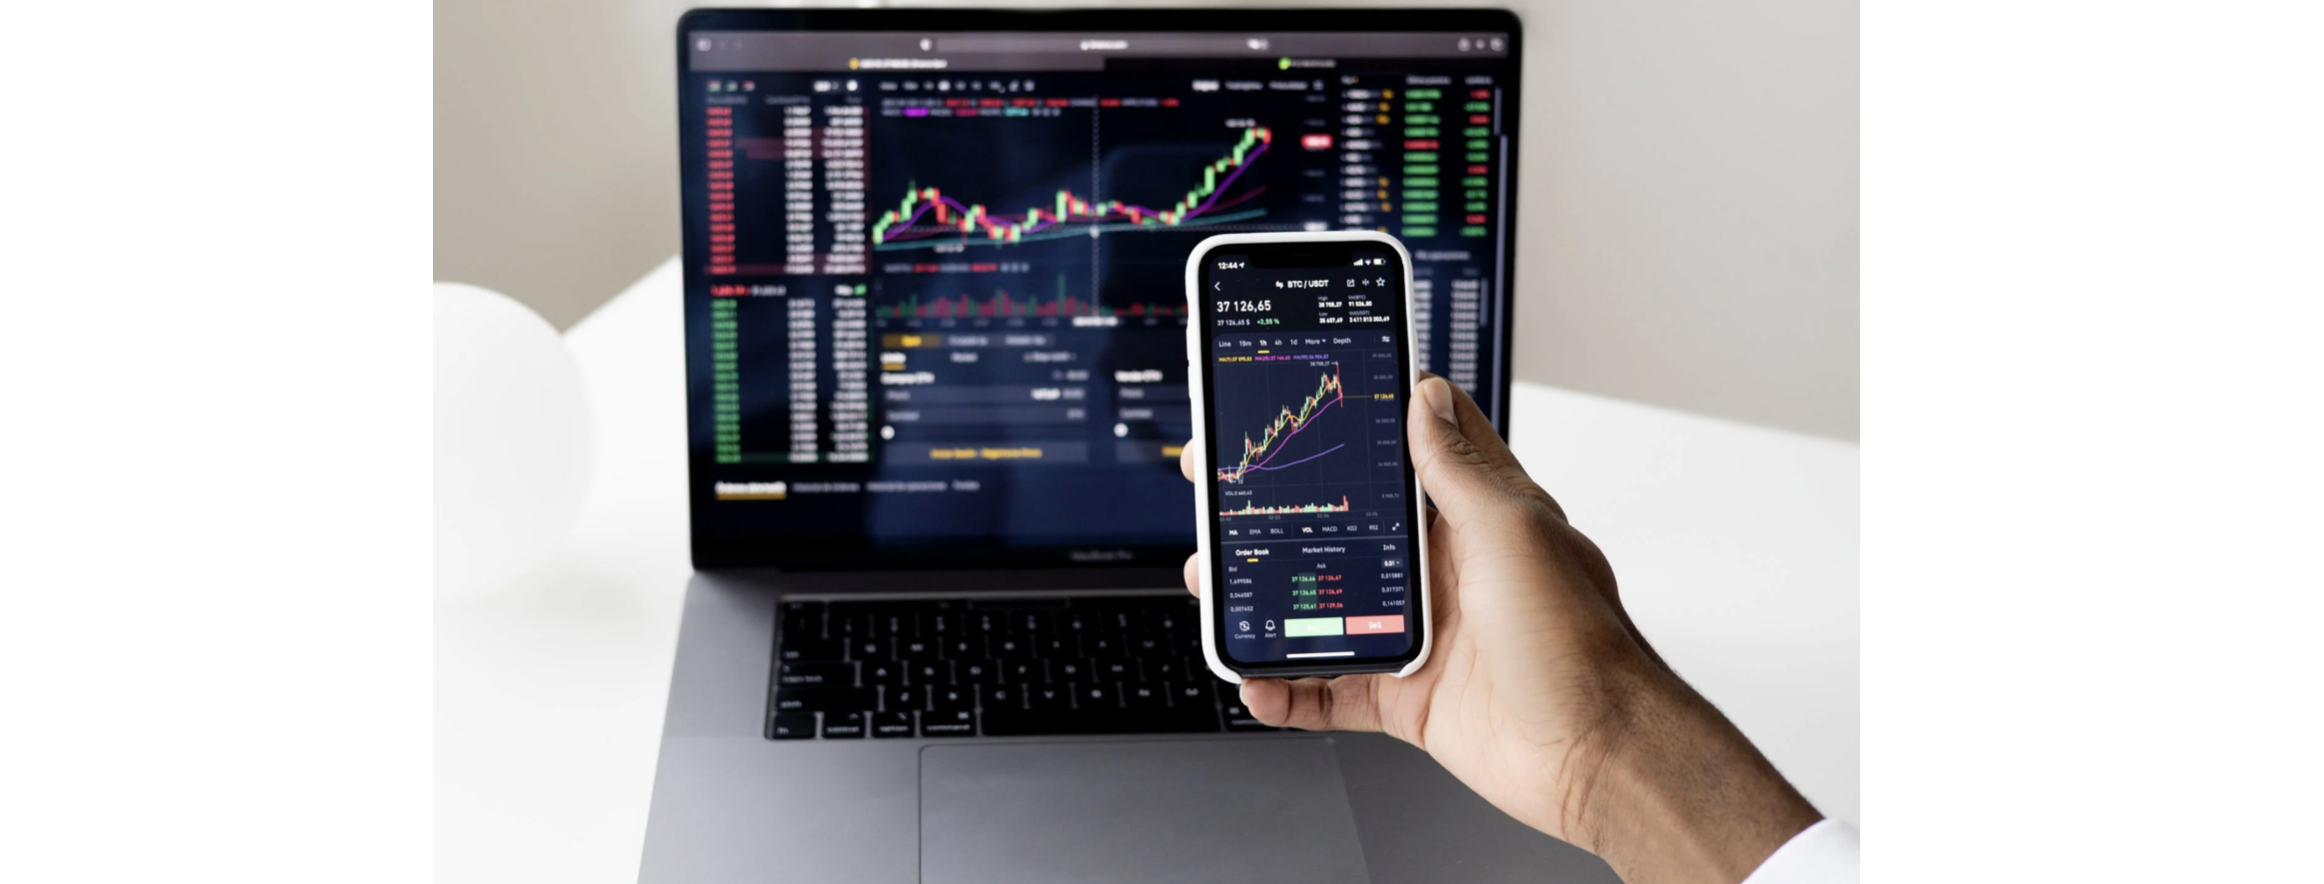
There are many analyses of investment, such as fundamental analysis and technical analysis are the two main analyses. In the cryptocurrency market, most investors use technical analysis on trading. Binance integrates the Trading view function in the trading interface and provides many technical analysis tools for investors to use. However, it may not be easy to understand each indicator means for some novice. Here we will tell you technical analysis to make it easier for novice.
What is technical analysis?
Technical analysis is a trading technique employed to evaluate investments and identify trading opportunities in price trends and patterns seen on charts. The principles of technical analysis are derived from hundreds of years of financial market data. Early technical analysis was almost exclusively the analysis of charts because the processing power of computers was not available for the modern degree of statistical analysis. More technical tools and theories of technical analysis have been developed and enhanced until recent decades.
Technical analysis can be used on any security with historical trading data, such as stocks, futures, commodities, fixed-income, currencies, and other securities. Some investors who use technical analysis believe prices reflect all information, including fundamentals, so price and trading volume are the most important.
Technical analysis operates from the assumption that past trading activity and price changes can be valuable indicators of the future price movements. Technical analysis is an analysis methodology for forecasting the direction of prices through the study of past market data, primarily price and volume.
According to different analysis methods, technical analysis can basically be divided into the following two parts:
Technical indicators: It’s a mathematical calculations based on the price, volume, and open interest to analyze historical data, and predict future price movements. The most common technical indicators are including moving averages, the RSI, the KD and the MACD. Different analysis tools will result in different opinions and trends, so most investors usually refer to multiple indicators at once, or even create their own analytical tools/indicators.
Price Action: It refers to the movement of the price plotted over time. Different looks can be applied to a chart to make trends in price action more obvious for traders. Traders use different chart compositions to interpret trends, breakouts and reversals. Many traders use candlestick chart due to it’s easy to know price movements by displaying the open, high, low and close values in the context of up or down sessions. The most common chart patterns are including double top and bottom patterns, head and shoulders bottom, and etc..
Investors generally use indicators to determine the signals of buying or selling and use chart to determine long and short positions. If you understand how to use technical analysis tools, you can save more time on investment. For those who don't have time to study the fundamentals, such as reading company financial reports, white papers... etc, technical analysis is a better analytical method to start trading.